EIS measurements with multi sine Battery & Corrosion – Application Note 19
Latest updated: May 2, 2023Abstract
The electrochemical Impedance measurement is a powerful method for the characterization of an electrochemical system. The measurement duration at a frequency fi is inversely proportional to the frequency fi, and therefore the measurement takes a long time at low frequencies. The multisine mode allows a reduction of the total measurement time by exciting and measuring various frequencies at the same time.
In this note, a presentation of multisine mode is given. A comparison between the EIS diagram obtained with single sine mode and multisine mode on a battery system is also provided.
Introduction
EIS measurements can sometimes take a very long time, especially at low frequencies. This can be an important issue for time variant systems.
To overcome this problem, it is useful to work in multisine impedance measurement mode. This measurement mode consists of exciting and measuring various frequencies in the same time contrary to the single sine measurement mode.
The multisine measurement is defined as the sum u(t) of the sinusoids at different frequencies with the same amplitude A and different phases Φ [1,2]:
$$u(t) = A\sum_{k\ =\ 1}^{N}{\mathrm{cos}(2\pi f_kt +\Phi _k)} \tag{1}$$
with the phase $\Phi _k = \Phi _1 – 2\pi \sum_{n = 1}^{k\ -\ 1}{\frac{k – n}{N}} $ and N the number of frequencies.
The EIS multisine measurement developed in EC-Lab® software is defined in order to reduce the crest factor defined by [3,4]:
$$Cr(u) = \frac{u_{\mathrm{M}} – u_{\mathrm{m}}}{2u_{\mathrm{eff}}}$$
with $u_{\mathrm{eff}} = A\sqrt{\frac{N}{2}}$
The aim of this application note is to compare EIS measurements with and without multisine mode.
Experimental
Electrochemical Impedance Spectroscopy measurements in single sine or multisine were carried out on a lithium-ion battery (ANR26650, A123 System). This 2.3 Ah battery, with nanophosphate as the positive electrode, was studied using the PEIS technique. All the measurements were done at 0 V vs. the Open Circuit Potential, i.e. ~ 3.31 V.
Impedance scans were put in place from 200 kHz down to 10 mHz. Note that measurements were achieved with EC-Lab® software and an 8 A booster kit. The multisine measurements are effective only below 1 Hz. The other parameters are set to be equal to 10, 5, and 0.5 for the sinus amplitude (Va), the pw value, and the average Na, respectively. The drift correction option was on.
The settings for the single and multisine measurements on a lithium-ion battery are identical, and multisine settings are reported in Figure 1.
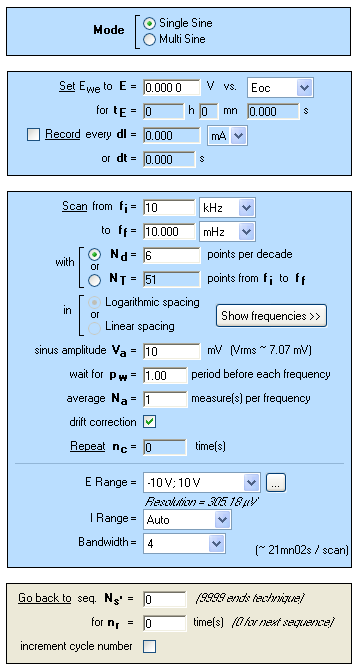
Figure 1: EIS multisine measurement settings.
Results
Impedance diagrams obtained are shown in Figure 2. The whole diagram is given at the top of the three diagrams shown in Figure 2. The impedance diagrams are superimposed, regardless of the frequency. The right overlapping of single sine and multisine impedance diagrams is displayed in the zooms in low and high frequencies in Figure 2 (middle and bottom).
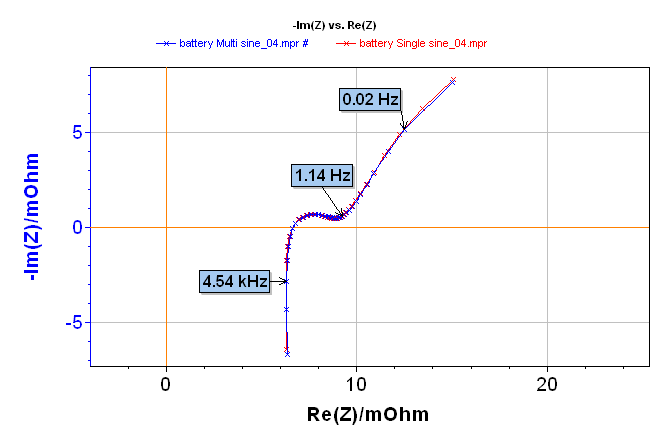
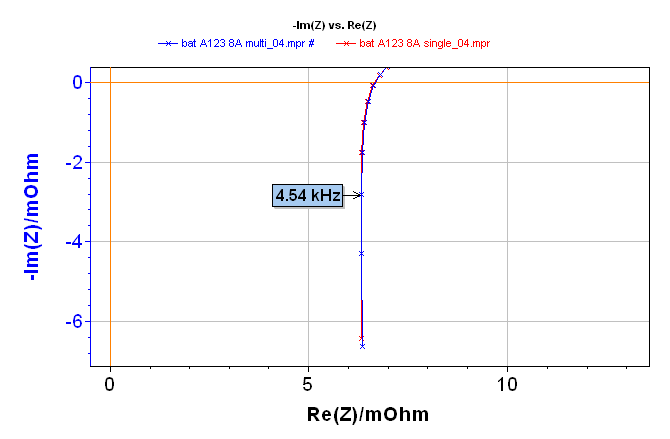
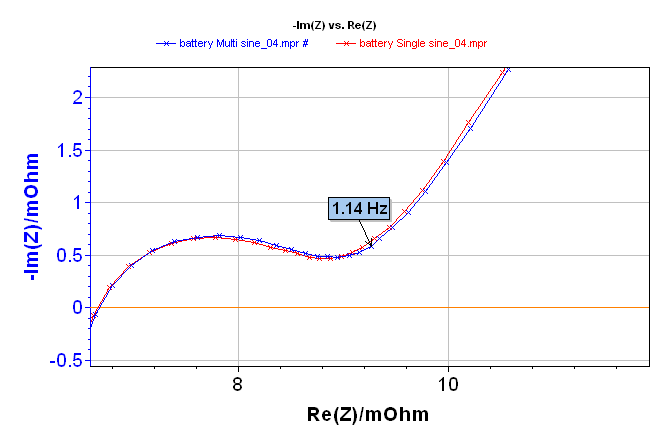
Figure 2: Electrochemical Impedance Spectroscopy measurement on a lithium-ion battery done with single sine (red line) and multisine (blue line) mode: total diagram in the top, zoom in the low frequencies range in the middle, and zoom on the high frequencies range in the bottom.
Figure 3 gives the time comparison for doing both of the EIS experiments. A single sine measurement needs 20 min 38 s, whereas a multisine measurement takes 5 min 22 s. It is then obvious that multisine measurements are faster by a factor close to four times the measurements in single sine mode. This saving of time and thus a faster measurement is a good way to avoid the drift of some electrochemical systems.
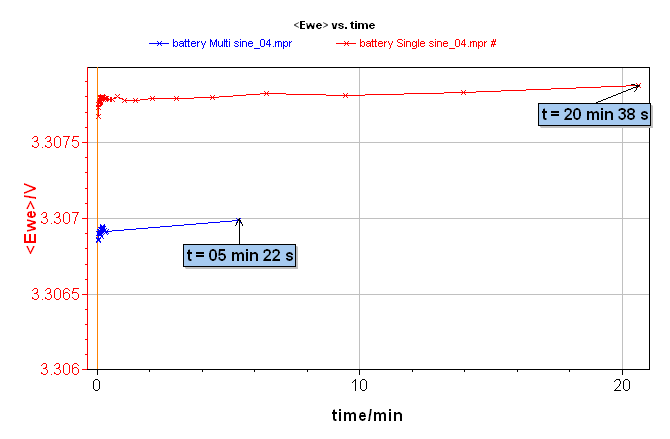
Figure 3: Comparison of the Ewe vs. time for EIS measurement on lithium-ion battery using single sine (red line) or multisine (blue line) mode.
Conclusion
EIS measurement in multisine mode is a good way to save time and therefore avoid changes or drift of the electrochemical system with time. Depending on the system, EIS measurements allow the user to carry out experiments 3 to 4 times faster than in single sine mode with the same accuracy.
Nevertheless, users must be careful of the definition of experimental conditions. Indeed, considering the principle of the multisine measurement, the excitation is defined for all the frequencies; consequently each frequency is less excited than in single sine mode. This can imply noisy measurements. However, increasing the level of excitation can cause non-linear conditions for EIS measurement and disturb impedance results [5].
References
- E. Van Gheem, J. Vereecken, J. Schoukens, R. Pintelon, P. Guillaume, P. Verboven and L. Pauwels, Electrochim. Acta 49 (2004) 2919.
- E. Van der Ouderaa, J. Schoukens, J. Renneboog, IEEE Trans. Instrum. Meas. 37(1) (1988) 145.
- R. Pintelon and J. Schoukens, System identification, IEEE Press, (2001).
- M. R. Schroeder, R. Pintelon, Y. Rolain, IEEE Trans. Instrum. Meas. IM-49 (2000) 275.
- Application note #9 “Linear vs. non linear systems in impedance measurement”
Revised in 04/2023


