

Precision and Accuracy in Coulombic Efficiency Measurements (High Precision Coulometry HPC) Battery – Application Note 53
Latest updated: May 28, 2025Abstract
Coulombic efficiency is one of the main factors determining the useful life of a Li-ion cell and battery. Therefore the accurate determination of any capacity loss and/or inefficiency in subsequent charge-discharge cycles may allow making predictions with respect to the useful battery life. However, this requires reliable and precise data, with as little noise as possible, so that the only factor contributing to the measured capacities is the cell itself, and not inaccuracies of the instrumentation, and/or temperature changes. Being able to predict what the battery will be after 2000 cycles, after running on 20 or 30 streamlines and accelerating battery testing, makes it also a lot cheaper. Very precise Coulometry also allows for fast and efficient prescreening of different electrode and electrolyte formulations.
AN#53 discusses instrument accuracy according to prof. Jeff Dahn’s definition, the idea that no stochastic phenomena takes place inside the battery cell. This most likely is not the case, given that different accuracies are measured for the same instrument, but different battery chemistries. It is likely that BioLogic potentiostats, galvanostats and battery cyclers are so precise that they do not introduce any significant artifacts to measured Coulombic efficiencies.
Introduction
In the last few years, several research projects have focused on Coulombic Efficiency (CE) as a tool to study battery lifetime [1–8]. Quantifying the influence on battery lifetime by changes in electrodes or electrolytes, under classical testing conditions (simply charge-discharge conditions), requires extremely long lead times. As opposed to simple cells cycling measurements (cycling until cells reach their end of life), CE measurements can be improved in short periods of time (3-4 weeks) and also provide a tool to evaluate and compare the stability of different cells.
The CE is defined as a ratio of the charge delivered during the discharge, Qdis, to that stored during the charge, Qch1:
$$\text{CE}=\frac{Q_\text{dis}}{Q_\text{ch}}\times 100\tag{1}$$
Precision and Accuracy in CE Measurements
Within this context, high precision2 and high accuracy3 are recommended to determine the impact on electrode material or electrolyte, throughout its lifetime, in just a few weeks of measurement.
The precision of CE determination is affected by the precision in the Q measurement. The charge delivered or stored during the discharge/charge, at constant current, is defined as Qdis/ch = I x Δt4 where I is the discharge/charge current and Δt is the time interval during discharge/charge. The variation of voltage during cycling could be affected by different phenomena, e.g. temperature. So Q determination is affected by different factors as the precision in current & voltage measurements, time determination, temperature change, etc…
The quality of the CE measurements was quantified in the literature [2, 4] by fitting the CE data (vs cycle number) with a second order polynomial function (least square regression). After fitting, the root-mean-square error (RMSE) can be calculated as:
$$\text{RMSE}=\sqrt{\frac{\sum^n_{i=1}\left({\chi_\text{exp}}_i -{\chi_\text{fit}}_i\right)^2}{n}}\tag{2}$$
Where xexp is a given data point and xfit is the corresponding point given by the fitting function. The parabolic function is only suggested to accurately fit the CE vs. number cycles data, and is not intended to provide a predictive model. A RMSE value of at least ±0.01% was recommended to distinguish the impact of changes in the battery components.
CE Measurement
Experimental Conditions
The tests presented in this application note were performed using commercial batteries:
- LiNixMNyCozO2 (NMC) with nominal capacity of 2.6 A h, 18650 format.
- LiCoO2 (LCO) with nominal capacity of 2.4 A h, 18650 format.
- LiFePO4 (LFP) with nominal capacity of 2.5 A h, 26650 format.
The discharge/charge measurements were carried out between the 4.2 and 2.75 V for the NMC and LCO technologies and between 3.6 and 2.0 V for the LFP batteries, at C/10 regime. As recommended in the literature, the temperature was controlled accurately at 30.0±0.1 °C (thermostatic chamber Memmert, IPP500).
In order to test the reproducibility of BioLogic cyclers, cycling (channel check) were performed on 40 NMC batteries, 20 LCO batteries and 16 LFP batteries, with a VMP3 (16 channels) and a BCS-815 battery cycler (8 channels). Over-crossed measurements were also carried out to validate the obtained results.
Software Tools
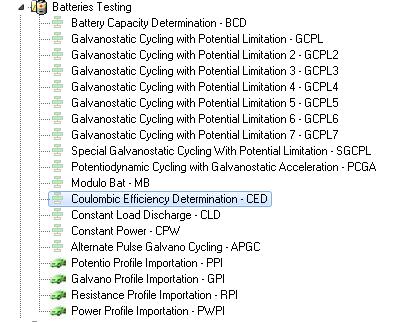
These measurements were carried out using the CED technique available in EC-Lab® soft-ware (Fig. 1) for the VMP3 and BT-Lab® software for the BCS-815. The CED technique is available in the “Battery testing” section.

Figure 1: CED technique.
Charge and discharge are performed under galvanostatic control, between the limit potentials, EM1 and EM2. The charge and discharge periods can be set in current or C-rate. No floating period is available (Fig. 2).
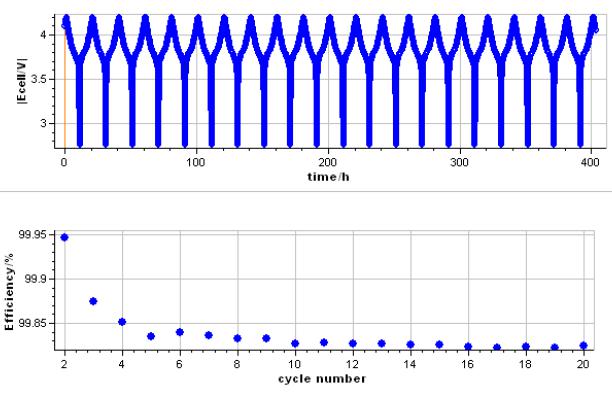
The output displays show the change of Ewe vs time and in a second graph the Efficiency vs cycle (Fig. 3).

Figure 2: Parameter setting windows for the CED technique.
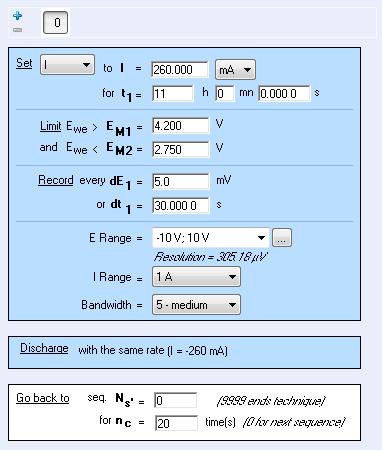

Figure 3: Potential vs. time during cycling and CE vs. cycle number for a mixed Li-ion battery (LCO-LMO type).
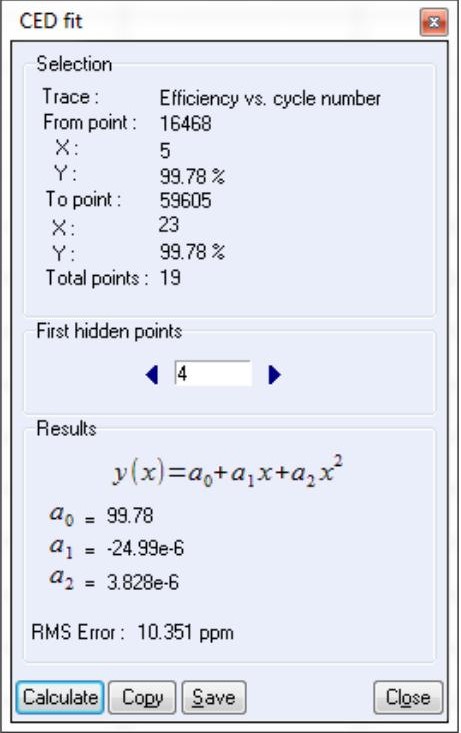
The user can also calculate the RMSE value associated to CE measurements using “CED Fit”, see Fig. 4. The polynomial fit and the corresponding RMSE values are automatically calculated at the end of the measurement. This tool is also available in the “Analysis” → “Battery” menu (or “Supercapacitor” menu). It could be also used using the “on the fly” mode.
First points of the cycling may be removed by using the “First Hidden point” option.

Figure 4: CED Fit windows.
Discussion
Figure 5 shows cell potential vs. time, during the charge and discharge on NMC, LCO and LFP batteries. Typical CE vs. cycle number curve is shown in Fig. 6. The corresponding polynomial fit and the RMSE value obtained are also indicated. Best RMSE result obtained after analysis is also shown in Fig. 6.
Tab. 1 describes the RMSE values obtained after analysis for both BioLogic instruments and on different type of batteries. As one can observe, the RMSE value obtained depends on the battery technology. Best results are obtained on LCO batteries for both tested instruments.
Fig. 7 shows the comparison of RMSE values obtained on different battery technologies carried out with BioLogic instruments.
One can highlight that the LCO results are close to the RMSE value reported in the literature [4].

Figure 5: Potential vs. time during the charge and discharge at C/10 for: top: a NMC battery, middle: LCO battery and bottom: LFP battery.
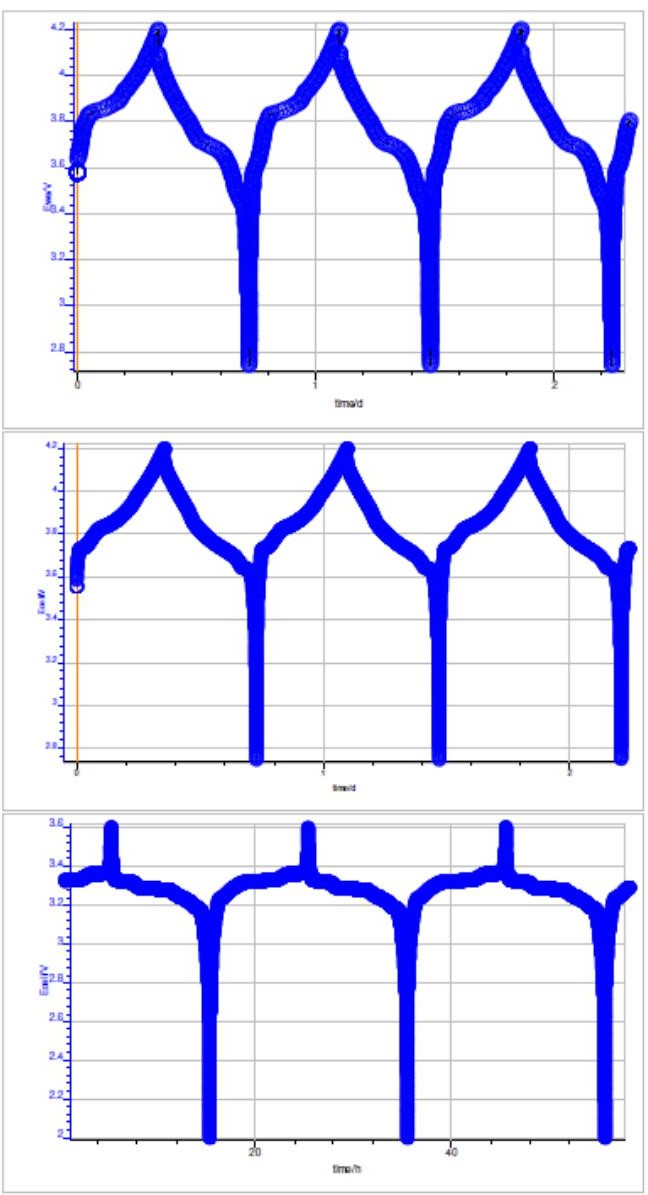
Table I: RMSE typical and best values obtained after analysis on different batteries technologies with BioLogic instruments.
| Battery | type | VMP3 | BCS |
|---|---|---|---|
| NMC | Typical Best | 32±8 ppm 11.5 ppm | |
| LCO | Typical Best | 11±3 ppm 6.4 ppm | 11±5 ppm 6.3 ppm |
| LFP | Typical Best | 21±5 ppm 15 ppm |

Figure 6: CE vs. cycle number, the corresponding polynomial fit. Inset: RMSE value. Top: typical result on a 18650 – NMC battery. Bottom: best result obtained on LCO battery.
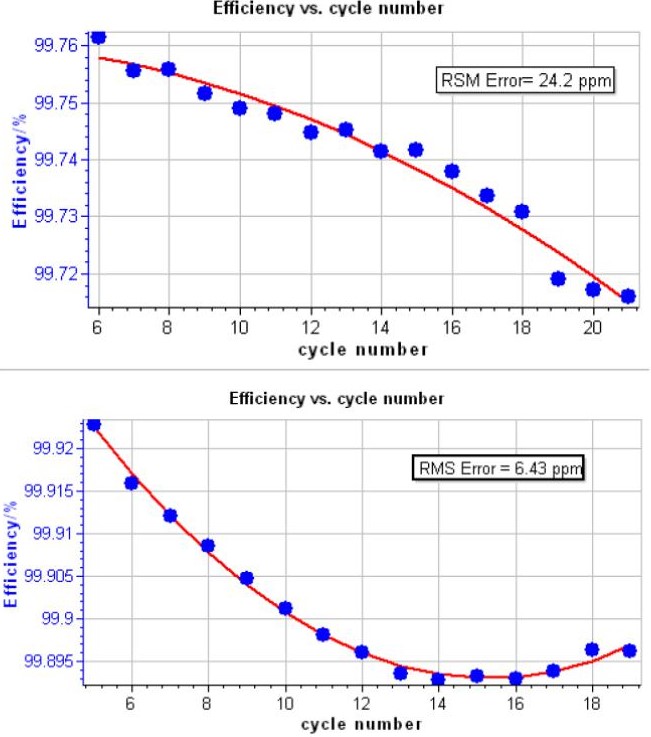

Figure 7: Comparison of RMSE values yielded on different batteries technologies with BioLogic instruments: VMP3, BCS-815.
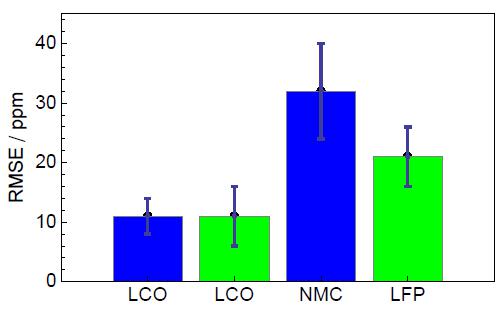
The CE measurements performed with a high precision can be used to evaluate the impact of electrolyte additives, impurities, electrodes materials, temperatures, throughout the lifetime of Li- ion batteries. The VMP3 and BCS-815 instruments allow CE measurements to be performed with high precision, and typical RMSE values of about 11 ppm, compared with the value reported in the literature.
References
1) J. J Murray and J. E. A. Alderson J. Power Sources, vol. 26 (1989) 293.
2) A. J. Smith, J. C. Burns, S. Trussler, and J. R. Dahn J. Electrochem. Soc., vol. 157, no. 2 (2010) A196.
3) J. C. Burns, G. Jain, A. J. Smith, K. W. Eberman, E. Scott, J. P. Gardner, and J. R. Dahn J. Electrochem. Soc., vol. 158, no. 3 (2011) A255.
4) T. M. Bond, J. C. Burns, D. A. Stevens, H. M. Dahn, and J. R. Dahn J. Electrochem. Soc., vol. 160, no. 3 (2013) A521.
5) J. C. Burns, A. Kassam, N. N. Sinha, L. E. Downie, L. Solnickova, B. M. Way, and J. R. Dahn J. Electrochem. Soc., vol. 160, no. 9 (2013) A1451.
6) S. R. Li, C. H. Chen, J. Camardese, and J. R. Dahn J. Electrochem. Soc., vol. 160, no. 9 (2013) A1517.
7) J. E. Harlow, D. A. Stevens, J. C. Burns, J. N. Reimers, and J. R. Dahn J. Electrochem. Soc., vol. 160, no. 11 (2013) A2306.
8) R. Petibon, E. C. Henry, J. C. Burns, N. N. Sinha, and J. R. Dahn J. Electrochem. Soc., vol. 161, no. 1 (2014) A66.
9) “Nomenclature, symbols and definitions in electrochemical engineering”, Pure Appl. Chem., vol. 85 (1993).
10) International vocabulary of metrology – Basic and general concepts and associated terms. Joint Committee for Guides in metrology (2012).
Appendix: Error Calculation
1 – DQ Error Calculation
Under constant current charge/discharge, the charge is defined as:
$$Q+It_e\tag{3}$$
where I is the applied current and te the elapsed time during the charge/discharge. If dI and dt are the uncertainties, or error, on I and t determination, the error associated with the Q determination could be expressed as:
$$\text d Q = \left|\frac{\partial Q}{\partial t}\right|\text d t + \left|\frac{\partial Q}{\partial I}\right|\text d I\tag{4}$$
Where ∂Q/∂t is the discharge/charge current and ∂Q/∂I is the discharge/charge time.
dI corresponds to precision in the current measurement and, the time precision, dt, is a function of battery potential and temperature (te =f(V, T)) and it has a dependence with the detection of limit potentials. So, dt can be expressed as:
$$\text d t = \left|\frac{\partial t}{\partial V}\right|\text d V + \left|\frac{\partial t}{\partial T}\right|\text d T\tag{5}$$
By combining (4) and (5), we obtain:
$$\text d Q = \left|\frac{\partial Q}{\partial I}\right|\text d I + \left|\frac{\partial Q}{\partial t}\right|\left|\frac{\partial t}{\partial V}\right|\text d V + \left|\frac{\partial Q}{\partial t}\right|\left|\frac{\partial t}{\partial T}\right|\text d T \tag{6}$$
Where ∂t/∂V is the reciprocal slope of potential as a function of time curve, at end of charge/discharge, dV is the error associated with the potential measurement, dT is the error of temperature measurement, and ∂t/∂T is the variation of charge/discharge time with the temperature. We can estimate this value as follow:
$$\frac{\partial t}{\partial T}=\frac{\partial t}{\partial V}\frac{\partial V}{\partial T} \tag{7}$$
Where ∂V/∂T is the thermal drift of potential. We can consider that this contribution is dominated by the battery. So, we can write dQ as:
$$\text d Q = \left|\frac{\partial Q}{\partial I}\right|\text d I + \left|\frac{\partial Q}{\partial t}\right|\left|\frac{\partial t}{\partial V}\right|\text d V + \left|\frac{\partial Q}{\partial t}\right|\left|\frac{\partial t}{\partial V}\right|\left|\frac{\partial V}{\partial T}\right|\text d T \tag{8}$$
dΦQ Error Calculation
As mentioned above, Coulombic Efficiency (ΦQ or CE) is defined as:
$$\phi_Q = \frac{Q_\text{dis}}{Q_\text{ch}}\tag{9}$$
So the associated error in the ϕQ determination is therefore:
$$\text{d}\phi_Q = \frac{\text{d}Q_\text{dis}}{Q_\text{ch}}+\frac{Q_\text{dis}}{Q_\text{ch}^2}\text{d}Q_\text{ch}\tag{10}$$
Data files can be found in :
C:\Users\xxx\Documents\EC-Lab\Data\Samples\ Battery\ AN53_LCO_LIS-18650_CED_CA1
Revised in 07/2018
1 The CE is noted ϕQ in IUPAC [9] nomenclature.
2 The precision here is defined as the closeness of agreement between indications or measured quantity values obtained by replicate measurements on the same or similar objects under specified conditions according with [10].
3 The accuracy here is defined as the closeness of agreement between a measured quantity value and a true quantity value of a measurement according with [10].
4 The charge is calculated in general by integrating the current that is transferred during the time it takes to carry out a given discharge or charge: Q =∫I(t)dt. The error calculation in the Q determination is shown in the Appendix.


