Ic-SECM – Bipolar Plates Scanning Probes – Application Note 23
Latest updated: June 17, 2024Introduction
Fuel cells are a favored option in the drive to a low carbon economy. An understanding of the components of the fuel cell can aid in better design and manufacture. One such component which should be understood is the Bipolar Plate (BPP). BPP are a key component of fuel cell stacks, and make up 80% of the fuel cell stack weight [1, 2]. The BPP is a multi-purpose component acting to separate fuel cells in the stack, distribute fuel and manage water flow through the cell, carry current from the cell, and in some cases, act to dissipate heat from the cell [1, 3, 4]. In this note Scanning ElectroChemical Microscopy (SECM) is used to investigate three different graphitic BPP compositions provided by Eisenhuth GmbH & Co. KG. SECM has previously been used to investigate fuel cell components, though this has mostly focused on the catalytic materials [5-8]. SECM is useful in the study of BPP materials because it can demonstrate the mixing of the conductive particles within the BPP providing information on the production process. In this note Intermittent Contact (ic)-SECM was used on the M470 to obtain further information about the sample topography.
Experimental
Three different BPP compositions were provided by Eisenhuth GmbH & Co. KG, these are labelled as BPP1, BPP2, and BPP3. ic-SECM measurements were carried out on all three samples in 5 x 10⁻³ mol L-1 KI/0.1 mol L-1 KCl solution using the M470. The 10 µm Pt probe is biased in this experiment at 0.7 V vs. Ag/AgCl to convert I– to I3-. Prior to performing the ic-SECM measurement the probe was biased until a stable current was measured. Area scans were all performed with a step size of 2.5 µm, and step velocity of 25 µm s-1.
Background correction was performed on all topography measurements. This is necessary because sample tilt is not corrected for during experiment setup, therefore if background correction is not performed the actual topography of interest is overshadowed by sample tilt. Post processing, including background correction and removal of outlier points, on all maps was performed in Gwyddion V2.53 [9].
Results
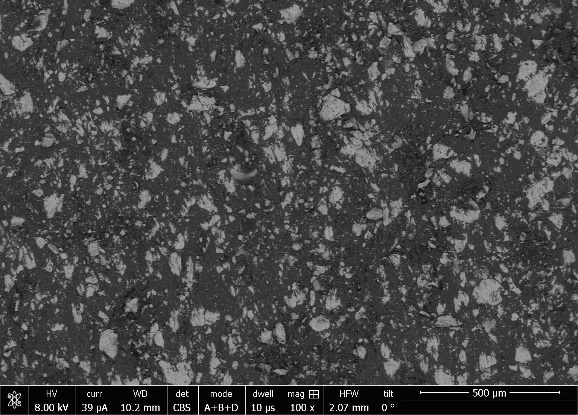
All three BPP samples are composed of conductive filler particles within a non-conductive matrix, as shown by the model Reflected Electron Microscope (REM) im-age provided by Eisenhuth GmbH & Co. KG, Fig. 1. This figure represents the overall heterogeneous mixture of conductive filler (light gray) in a non-conductive matrix (dark gray). Compared to BPP made of pure graphite this structure provides a higher mechanical stability by flexibility.

Figure 1: Representative REM image of BPP provided by Eisenhuth GmbH & Co. KG.

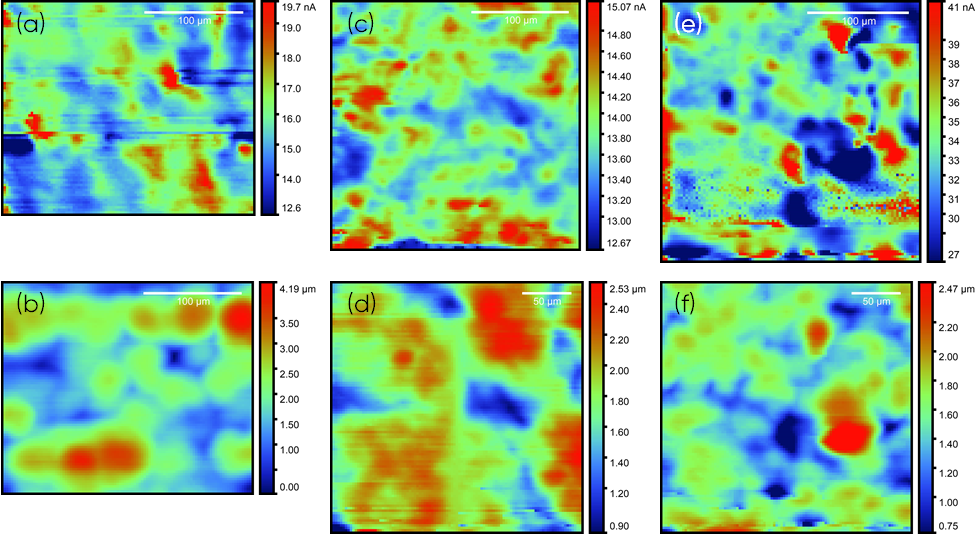
Figure 2: dc current and topography maps measured from ic-SECM of BPP1, (a) and (b), BPP2, (c) and (d), and BPP3, (e) and (f) respectively. ic-SECM measurements were performed in 5 x 10⁻³ mol L-1 KI/0.1 mol L-1 KCl, with a 10 µm Pt probe biased at 0.7 V vs. Ag/AgCl
The probe dc current and topography area maps for all three BPP are shown in Fig. 2. In all cases the measured dc current is greater than that measured by the SECM probe in bulk. This is reflective of positive feedback, indicating all three samples are conductive. Though the polymer matrix is non-conductive the overall conductivity of the samples may arise from the filler particles having reached their optimum threshold, allowing for conductive tracks throughout the matrix. For all three samples the dc current shows heterogeneous activity, with the highest current regions reflecting the largest conductive particles of the BPP. This correlates well with the provided REM data. The dc current maps can be directly compared to the topography map measured simultaneously in the ic-SECM experiment. From this comparison it can be concluded that the BPP have an underlying topography which does not relate to the spread of conductive particles within the BPP. This topography instead arises from the surface finish, which does not produce a flat finish.
An understanding of the grain size and distribution is important in the preparation of BPP. Larger grains of conductive fillers are useful because they increase the conductor area, while decreasing high resistance interfaces. On the other hand, when these grains are too large the mechanical stability of the material is reduced. The optimum grain size, therefore balances these two characteristics, and is determined by the particular application of the BPP. Using the Gwyddion software it is possible to perform grain analysis on the dc current images to compare the spread of the conductive particles in the three samples. From the grain analysis it can be determined that all three samples have a similar spread of conductive particles at the surface. It can be seen, however, that the conductive particles typically have a larger area in BPP2 than in either BPP1 or BPP3. This is summarized in Tab. 1. The differences in grain size may arise from the particular production method for each BPP type, as the conductive grain may be a mixed powder, or a homogeneous particle.
Table I Comparison of the grain areas of the three different BPP.
| Sample | Relative Area | Mean Grain Area |
| BPP1 | 46.9% | 1049 µm2 |
| BPP2 | 47.7% | 2535 µm2 |
| BPP3 | 47.4% | 1373 µm2 |
Conclusion
A set of BPP have been investigated using ic-SECM. Through this analysis the electrochemical activity and topography of the BPP was mapped. Using the electrochemical activity map of the BPP it is possible to investigate the location, agglomeration, and mixing of the conductive particles in the BPP. Furthermore, the information provided by the SECM measurements can reflect the effect of the different grain types in the electrochemical characteristics of the BPP. This demonstrates the applicability of SECM to fuel cell components aside from the catalytic materials which have been traditionally studied. Furthermore, this sort of mixing analysis could be applied to other fields, for example batteries, as discussed in AN#21 [10].
Acknowledgements
We warmly thank Eisenhuth GmbH & Co. KG for providing the three BPP samples used in this work.
References
- Hermann, T. Chaudhuri, P. Spagnol, Int. J. Hydrog. Energy, 30, 12 (2005) 1297-1302
- G. Reddy, J. Mater. Eng., 2006, 15, 4, 474–483
- Mehta, J. Smith Cooper, J. Power Sources, 114, 1, (2003) 32-53
- Tawfik, Y. Hung, D. Mahajan, J. Power Sources, 163, 2, (2007) 755-767
- Ben Jadi, A. El Guerraf, E.A. Bazzaoui, R. Wang, J.I. Martins, M. Bazzaoui, J. Solid State Electrochem., 23, 8 (2019) 2423–2433
- Schulte, S. Liu, I. Plettenberg, S. Kuhri, W. Lüke, W. Lehnert, G. Wittstock, J. Electrochem. Soc., 164, 7 (2017) F873-F878
- Umeda, S. Shironita, T. Sakai, M. Ide, H. Ikeda, Electrochim. Acta, 128, (2014) 259-264
- Lu, J. S. Cooper, P. J. McGinn, J. Power Sources, 161, 1, (2006) 106-114
- http://gwyddion.net/
- SCAN-Lab AN#21 “Using the SECM150 to Measure an NMC Battery Electrode”
Revised in 06/2020


