

Intermittent Contact (ic) SECM for relief of major topographic features Scanning Probes – Application Note 16
Latest updated: June 14, 2024Abstract
Using ic-SECM the probe to sample distance can be maintained over large areas making it useful for not only removing the influence of sample tilt, but also for measuring samples with major topographic features for example curved samples or embossed samples. This application note aims to demonstrate the use and the efficiency of the ic technique in the measurement of 4 different samples: two curved samples, one sample with large topographic changes and a 20 cent Euro coin.
Introduction
ic-SECM is a relatively recent technique developed at the University of Warwick which allows the topography of a sample to be tracked during an SECM measurement. [1] Using ic-SECM the probe to sample distance can be maintained over large areas making it useful for not only removing the influence of sample tilt, but also for measuring samples with major topographic features. The M470 allows the user to implement the ic technique in both dc- and ac-SECM measurements. This application note aims to demonstrate the use of the ic technique in the measurement of samples with major topographic features. This is demonstrated using four samples: (1) a concave sample, (2) a convex sample, (3) a steel weld, and (4) a 20 cent Euro coin.
Why use ic Techniques?
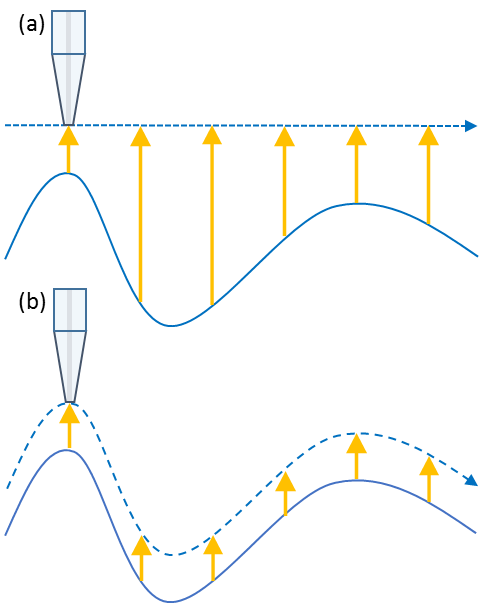
ic-SECM allows the UME probe to maintain a constant distance to the sample allowing the simultaneous measurement of the electrochemical and topographic signals. In traditional SECM measurements the probe is held at a constant height throughout the measurement resulting in an electrochemical signal which is a mixture of the electrochemical and topographic characteristics of the sample. By maintaining a constant distance from the sample ic-SECM allows for separate measurements of the topographic and electrochemical signals, without the influence of one on the other. This can be demonstrated, for example, with an ideal homogeneously insulating sample. When measured through constant height SECM techniques the measurement will result in a current of a larger magnitude being recorded at lower topographic regions than areas with high topography, Fig. 1a. On the other hand if ic-SECM is used the probe will maintain its distance to the sample throughout the measurement, resulting in a current of uniform magnitude throughout, Fig. 1b.

Figure 1: (a) When constant height SECM is used to measure a uniformly insulating sample the current (yellow arrows) is lower for higher topography regions. (b) When constant distance SECM is used to measure a uniformly insulating sample the current is uniform throughout the measurement.
In ic-SECM the probe vibrates at a known height and frequency in z. As the SECM probe approaches a surface this frequency is damped allowing it to be used as a control mechanism. ic-SECM is only one of a variety of SECM techniques developed to separate the electrochemical and topographic signals. However, as it controls to the surface using z vibration it can be used over larger areas of samples, without the requirement that the samples are homogeneously conducting or insulating. This is highly advantageous for measuring samples with large topographical features, and/or noticeable tilt.
Further information on the ic-SECM techniques can be found in the ic-SECM tutorial [2] and AN#6, 11 and 13 [3-5].
Results
The use of the ic technique to measure samples with large topographic features is demonstrated using a variety of samples. ic-dc-SECM has been used to measure a convex and concave sample, and a steel weld, while ic-ac-SECM has been used to measure a 20 cent Euro coin. 2D maps were produced with data correction performed in Gwyddion. 3D-IsoPlot was used to produce all 3D maps presented.
Convex Sample

Figure 2: A convex portion of aluminium rod was measured by ic-SECM. The arrow indicates a blemish on the surface which affects the measurement.
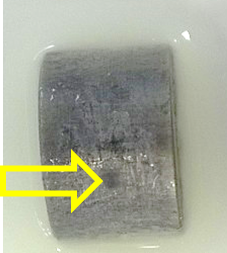
A 3.0 mm x 2.85 mm area of an aluminium rod, Fig. 2, was measured in a 5 x 10⁻³ mol/L KI/ 0.1 mol/L KCl solution. A 25 µm Pt UME biased at 0.6 V vs SCE was used. The probe was vibrated in z at 415 Hz. A control point of 75 % of the original vibration was used. The resulting topography and dc-current 2D maps are shown in Fig. 3.
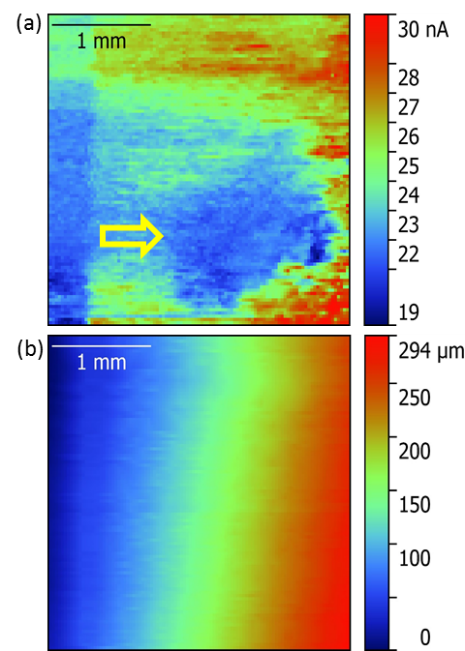
Based on the map in Fig. 3a an almost 0.3 mm change in topography was measured as the probe moved along the x axis of the sample. Such a change in topography would result in a current dominated by the topography using constant height SECM. With ic-SECM it can be seen that there is a band of low current on the left side of the sample and a low current spot in the middle neither of which are related to topographic effects. The low current spot in the middle of the dc-current measurement can be correlated to a dark blemish on the surface of the sample which causes a reduction in the positive feedback over the rest of the aluminium rod.

Figure 3: (a) The dc current response measured for the convex aluminium rod sample using ic-SECM. The yellow arrow indicates the low current area corresponding to the blemish on the surface. (b) The corresponding topographic response.
Concave Sample

Figure 4: The concave sample measured by ic-SECM.
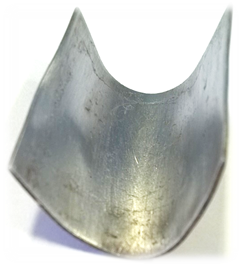
A 5.0 mm x 5.0 mm area of the inside of a metal former, Fig. 4, was measured in 0.01 mol/L H2SO4 using a 25 µm Pt UME biased at 0.65 V. At this potential Fe2+ from the freely corroding sample can be oxidised to Fe3+ by the UME [6]. A probe vibration of 415 Hz and a control point of 80 % were used. The resulting topography and dc-current signals can be seen in Fig. 5.

Figure 5: (a) The dc current signal measured for the inside of a metal former. (b) The corresponding topography signal showing the concave nature of the sample.
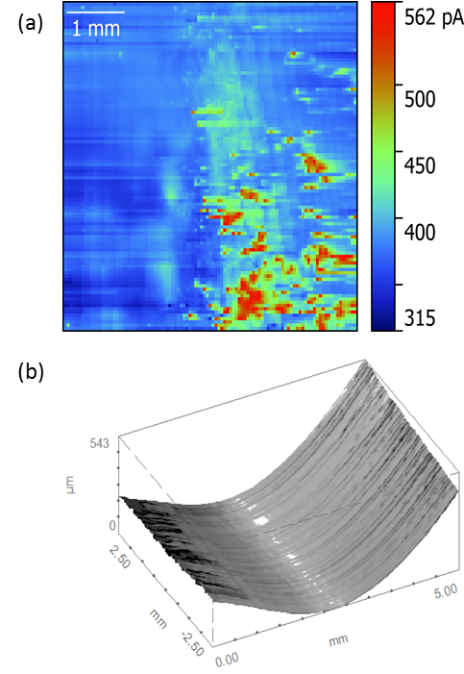
Figure 5a shows the area measured undergoes a change in topography of greater than 0.5 mm. By separating the topographic and dc-current signals it is possible to monitor the corrosion of the sample. The dc-current map shows the highest level of corrosion to be on the right side of the area measured.
Steel Weld
A steel weld from the front suspension arm of a popular off-road vehicle was mounted in the M470 in the orientation shown in Fig. 6. A 4.0 mm x 1.15 mm area of this sample, chosen to include both steel plates, was measured in 0.1 mol/L NaCl. The 25 µm Pt probe was biased at 0.6 V vs SCE to oxidize the Fe2+ from the freely corroding sample to Fe3+. The probe was vibrated at 445 Hz, and a control point of 75% was used.

Figure 6: The steel weld measured by ic-SECM.
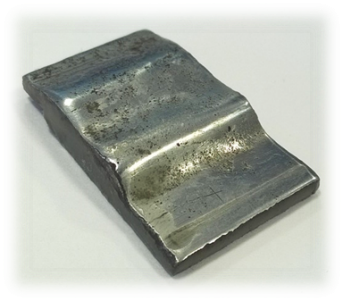

Figure 7: (a) The dc current response of the steel weld measured by ic-SECM. The corresponding topographic signal showing over 1.5 mm of change.
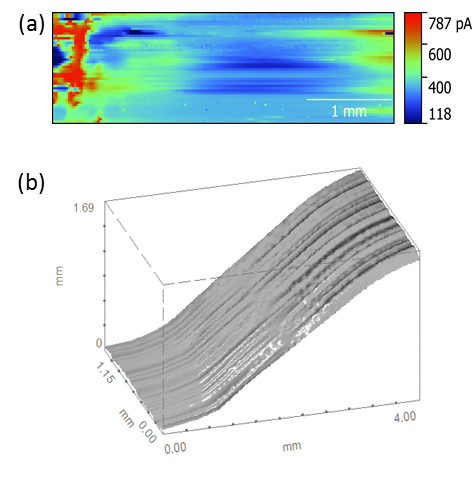
The topographic and electrochemical response are shown in Fig 7. It can be seen that a topography change of 1.69 mm has been measured on going from the bottom to the top steel plate. The corresponding electrochemical response shows a higher concentration of Fe2+ over the horizontal edges of the steel plates, with the strongest response over the bottom steel plate. The measurement of the response of both steel plates would be impossible to perform in a single experiment by constant height SECM. The tip to sample distance of at least 1.69 mm over the bottom steel plate, which would be required to include both plates in a conventional constant height SECM experiment, would allow only the bulk electrochemical response to be measured. This means the corrosion of the bottom steel plate would go undetected.
20 cent Euro coin

Figure 8: The 20 cent Euro coin shown was measured using ic-ac-SECM.
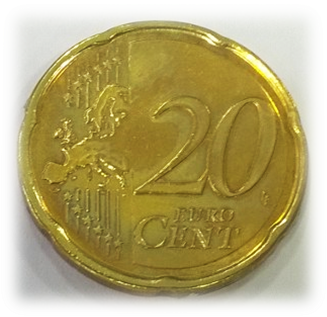
A 5.0 mm x 5.0 mm area of 20 cent Euro coin, Fig. 8, was measured in tap water by ic-ac-SECM using a 25 µm Pt UME. A SCE reference and Pt sheet counter electrode were used. A dc-bias of 0 V vs OCP, an ac-bias of 100 mV and an ac-frequency of 25 kHz were applied. Though it may be possible to use lower values the ac-bias and frequency values used here are known from prior experiments to give a distinctly different response when the probe is over an insulator or conductor. The resulting measurement is shown in Fig. 9.
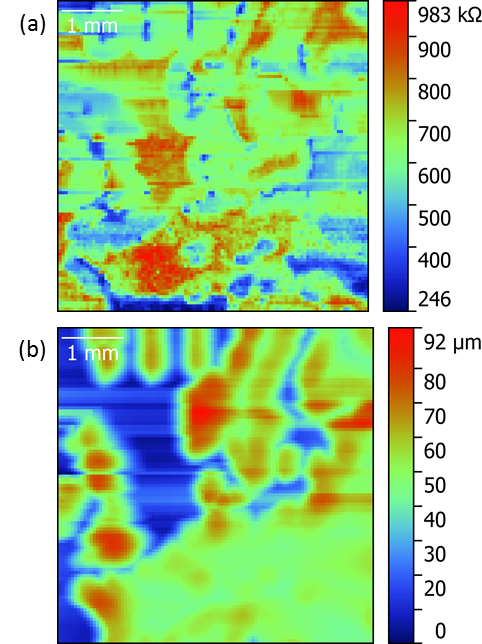
The topography map in Fig. 9a clearly shows a partial map of Europe from the common side of the coin. It can be seen that there is just under 100 µm of topography change after the tilt of the coin has been accounted for. Comparison of the 3D map of the topography to the map produced from the impedance magnitude shows that while generally the impedance is lower over the raised portions of the coin, these two maps are uncorrelated. There are however exceptions to this, such as the increased impedance over Scandinavia. Furthermore it can be seen that there is a distinct area of moderate impedance around the stripes in the top right corner which correlates to a relatively flat portion of the coin. The differences in impedance over the surface of the coin arise because the coin, which is composed of a copper, aluminium, tin, zinc alloy [8], tarnishes upon prolonged exposure to water.

Figure 9: (a) The impedance magnitude measured by ic-ac-SECM for a 20 cent Euro coin. (b) The corresponding topography signal
Conclusion
ic-SECM was presented as advantageous for resolving the electrochemical response of samples with major topographic features. With the M470 it is possible to use ic-SECM over the full range of the axis, i.e. 110 mm. Unlike traditional constant height SECM, or soft stylus probe SECM, ic-SECM allows for the separate measurements of electrochemical and topographic signals. This has been demonstrated using four samples with distinct topographic features.
References
- McKelvey, M. A. Edwards, P. R. Unwin, Anal. Chem. 82, 15 (2010) 6334-6337
- ic-SECM Tutorial “ic-SECM introduction”
- Application Note #6 “The advantages of using intermittent contact (ic) for SECM and ac-SECM measurements: two examples in corrosion.”
- Application Note #11 “Measurement of a nano-patterned gold sample by ic-ac-SECM”
- Application Note #13 “Investigation of an interdigitated array electrode using ic-SECM”
- Völker, C. González Inchauspe, E. J. Calvo, Electrochem. Comm. 8 (2006) 179-183
- Ha, H. Bindig, K. Williams, J.R. Scully, 220th ECS Meeting, 2011, Abstract #1797


