

Introduction to the Modular Map Experiment: an Interdigitated Array electrode example Scanning Probes – Application Note 14
Latest updated: June 14, 2024Abstract
AN#14 – Introduction to the Modular Map Experiment: an Interdigitated Array electrode example The Modular Map Experiment (MME) in the M470 software has been designed to allow users greater freedom in the SECM measurements they perform. In this application note, the use of the MME has been demonstrated by measuring an InterDigitated Array (IDA) electrode in generator-collector and competition mode experiments.
Introduction
The Modular Map Experiment (MME) in the M470 software has been designed to allow users greater freedom in the SECM measurements they perform. This experiment allows the user to perform a number of ChronoAmperometry (CA), and Linear Sweep Voltammetry (LSV) experiments at a point in an SECM area scan experiment before moving to the next point. This can also be used in conjunction with the optional USB-PIO accessory (Product Number: U-USB-PIO) to allow control of an external device, such as a lamp. For a description of the USB-PIO see SCAN-Lab AN#15 [1]
In this application note the use of the MME has been demonstrated by measuring an InterDigitated Array (IDA) electrode in genera-tor-collector and competition mode experiments, successively for each point of the area map. Unlike running these two experiments in sequence, the use of the MME means that the two maps are measured under the exact same experimental conditions, e.g. thermal drift occurs at the same rate, the location of measurement is repeated exactly, and electrode fouling which can occur during the initial experiment will not cause the following experiment to be unusable.
The IDA electrode used in this work was pro-vided by ELISHA systems Ltd. [2]. A scheme of the IDA is shown in Application Note 13 [3]. It is composed of two sets of interlocking gold fingers on a silicon substrate. Each gold finger has a width of 20 μm and is separated from the next finger by 10 μm of silicon. The gold fingers are contacted by a gold pad. ic-SECM was used in SCAN-Lab AN#13 to map an IDA electrode of this kind [4].
Using The Modular Map Experiment
The MME can be used for SECM experiments either with or without the USB-PIO. In this application note the USB-PIO was not used. The MME can be accessed through the SECM menu tab, as shown in Fig. 1. Once open the
“Sequence of Experimental Events” can be selected through the “Modular” tab, as shown in Fig. 2. The “Sequence of Events” is the main control panel for the MME. From here the user can configure which experiments, and relevant settings, are run at each point before moving on to the next point. The experiments available to the user for all MME configurations are: (1) Chronoamperometry at the probe or the sample. (2) Linear sweep at the probe or sample. When either of these experiments are performed the user can choose whether or not to acquire the data of the experiment. If the data is acquired the user selects the time when data acquisition begins, and how long it is averaged over. The end result of this data acquisition is a single point on the area map of each experimental event. If the optional USB-PIO accessory is used with the MME then the user can also select to read from or write to one or more channels of the USB-PIO.

Figure 1: The modular mapping experiment can be accessed through the SECM menu tab.
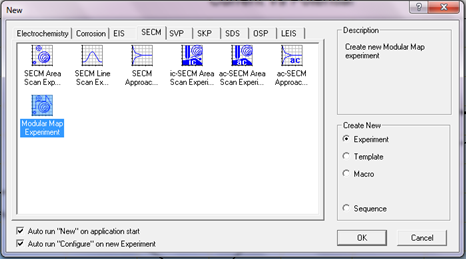

Figure 2: The modular tab allows the user to access the Sequence of Events. In this tab the experiments to be performed at each x-y point are selected.
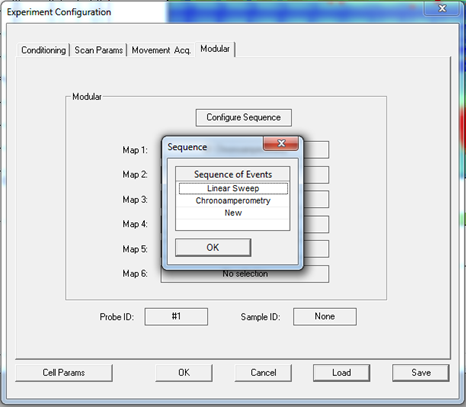

Figure 3: The “Modular” tab also allows the user to select the map corresponding to each experiment type.
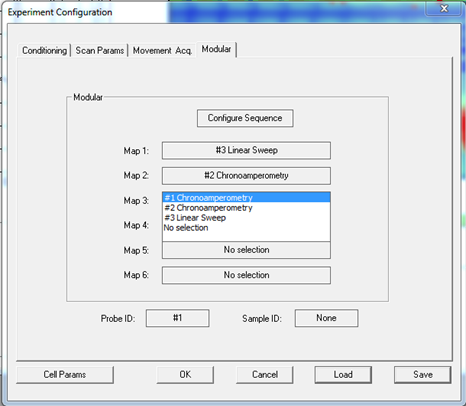
The MME configuration also allows the user to select how the maps are presented during the experiment, as shown in Fig 3. This can be particularly useful if the user would like to compare the area maps for two different measurements in the “Sequence of Events.”
Prior to running the MME it can be helpful to run individual chronoamperometry or linear sweep experiments to determine (1) the length of each experiment in the sequence and (2) the time at which data acquisition should start. By first performing these experiments the MME can be optimised to most efficiently collect the best possible results.
![Chronoamperometry experiment of an SECM Probe in 2.5 x 10⁻³ mol L-1 [Fe(CN6)]3-/[Fe(CN6)]4- / 100 x 10-3 mol L-1 KCl with the bias alternating between 0.65 and -0.25 V.](data:image/svg+xml;base64,PHN2ZyB4bWxucz0iaHR0cDovL3d3dy53My5vcmcvMjAwMC9zdmciIHdpZHRoPSI0NjYiIGhlaWdodD0iMzA5IiB2aWV3Qm94PSIwIDAgNDY2IDMwOSI+PHJlY3Qgd2lkdGg9IjEwMCUiIGhlaWdodD0iMTAwJSIgc3R5bGU9ImZpbGw6I2NmZDRkYjtmaWxsLW9wYWNpdHk6IDAuMTsiLz48L3N2Zz4=)
Figure 4: Chronoamperometry experiment of an SECM Probe in 2.5 x 10⁻³ mol L-1 [Fe(CN6)]3-/[Fe(CN6)]4- / 100 x 10-3 mol L-1 KCl with the bias alternating between 0.65 and -0.25 V.
![Chronoamperometry experiment of an SECM Probe in 2.5 x 10⁻³ mol L-1 [Fe(CN6)]3-/[Fe(CN6)]4- / 100 x 10-3 mol L-1 KCl with the bias alternating between 0.65 and -0.25 V.](https://biologic.net/wp-content/uploads/2019/08/scanan14f4.png)
An example chronoamperometry experiment run in 2.5 x 10⁻³ mol L-1 [Fe(CN6)]3- /[Fe(CN6)]4- / 100 x 10-3 mol L-1 KCl is shown in Fig. 4. In this experiment the tip bias was switched between 0.65 and -0.25 V vs. SCE every 3 s. It can be seen that after 2 s the current has mostly plateaued. Therefore when running a MME with the tip switching between 0.65 and -0.25 V vs. SCE a measurement time of 3 s with acquisition starting any time after 2 s would be appropriate.
Method
The IDA electrode was mounted on copper tape on a PTFE blank to allow contact to the gold fingers to be made. A contact between the copper tape and gold pads of the IDA is made with silver conductive paint. To ensure corrosion products from the copper tape do not foul the experiment the copper tape was sealed by painting a thin layer of ethyl cyanoacrylate on top.
The MME was performed in 2.5 mM [Fe(CN6)]3-/[Fe(CN6)]4- / 100 mM KCl, using a 10 µm diameter Pt UME probe. An SCE reference electrode and Pt sheet counter electrode were used. Prior to performing any measurements the IDA electrode was cycled sufficiently negative (-1.25 V vs. SCE and lower) to remove any contaminants from the surface.
The IDA was then held at -0.25 V vs. SCE throughout the MME. This was done by biasing the IDA sample using the multipotentiostat dialogue bar. The MME was composed of a two step sequence as follows:
- Generator-Collector Experiment: A 3.000 s chronoamperometry experiment where the tip is biased at 0.650 V. Data is acquired over 0.001 s (data rate of 1000 Hz) starting at 2.700 s.
- Competition Mode Experiment: A 3.000 s chronoamperometry experiment with the tip biased at -0.250 V. Data is acquired over 0.001 s (data rate of 1000 Hz) starting at 2.700 s.
This experimental sequence was carried out at each x-y point before moving to the next point. Using a 5 μm step size the IDA electrode was mapped over a 500 μm by 500 μm area.
The final maps were cropped to a 500 μm by 450.5 μm area to remove areas of excessive noise and processed using the Gwyddion soft-ware [4]. 3D maps were then obtained using the 3DIsoPlot software. More information on the 3DIsoPlot software are given in the SCAN-Lab AN#12 [5].
Results
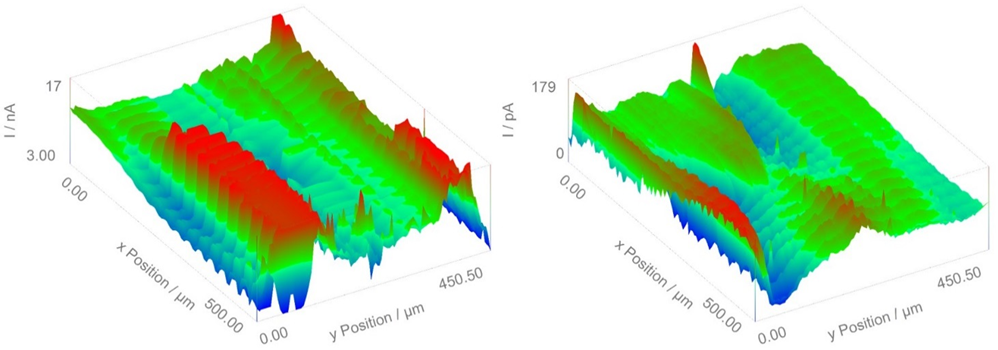
Using the two step MME outlined, the maps in Fig. 5 were obtained. The data of the competition mode experiment have been inverted to aid in comparison of the two maps. While both images show the expected peaks and troughs the magnitude of the current, and the location of the highest current differ. In the generator-collector experiment the gold fingers of the IDA electrode increase the [Fe(CN6)]4- species available to the SECM probe increasing the current magnitude measured at the probe. In the competition mode experiment the larger active area of the gold fingers compared to the probe greatly re-duces the concentration of [Fe(CN6)]3- available causing the magnitude of the current to go from nA to pA.

Figure 5: Using the modular map experiment area maps of a generator-collector (left) and competition mode (right) experiment could be collected simultaneously for an IDA electrode. To aid in comparison of the two experiments the data for the competition mode experiment has been inverted.
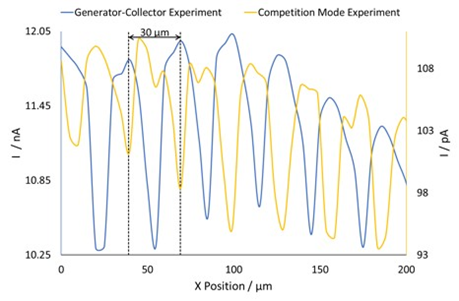
This reduction in concentration then leads to an increased current over the insulating silicon compared to the conductive gold fingers. Fig. 6, a cross section of both the generator-collector and the competition mode experiments, taken at the same y position, further demonstrates this effect. In both cross sections the high current peak is broader than the low current peak due to the diffuse layer around the gold surface. In the case of the generator-collector experiment the diffuse layer causes an increase in [Fe(CN6)]3- including at the edges of the silicon insulator, whereas in the competition mode experiment the [Fe(CN6)]4- species is depleted at the silicon insulator. These interactions of the gold bands with the mediator molecule of interest cause the shape of the current measured.

Figure 6: Comparison of the cross sections of the generator-collector and competition mode experiments. The data for the competition mode experiment has been inverted to aid comparison. The dashed black line indicates the 30 µm peak-to-peak separation.
Conclusion
In this note the MME has made it possible to measure an IDA electrode simultaneously in generator-collector and competition mode. It has been shown that the MME allows the user to perform SECM experiments in which multiple experiment types are carried out in sequence at each x-y point in the area scan. Un-like performing the experiments sequentially the MME does not require an entire area scan to complete before the next experiment type is performed, meaning the user can be confident that the experimental conditions have remained unchanged between experiment types.
Acknowledgements
The gold interdigitated array measured in this work was provided by Professor Paul Millner director of ELISHA Systems Ltd., and Professor of Bio-nanotechnology at the University of Leeds.
References
- SCAN-Lab Application Note #15 “Introduction to the USB-PIO: measuring the effect of light on a live leaf”
- ELISHA Systems Ltd www.immunosensors.com
- SCAN-Lab Application Note #13 “Investigation of an Interdigitated Array Electrode Using ic-SECM”
- Gwyddion data analysis software gwyddion.net
- SCAN-Lab Application Note#12 “3D Map production using the 3DIsoPlot software”


