

The advantages of using green light to follow fluorescence changesPhotosynthesis – Application Note 1
Latest updated: June 13, 2024Principle:
This application note aims to show how a JTS-10 can be used to follow fluorescence changes in a leaf, to study in-vivo photosynthetic processes. Experiments described here are based on a work realised by F. Rappaport et al (1).
Fluorescence phenomenon reflects the electron transport process and is controlled by the redox states of electron acceptor or electron donor of photosystem II.
The measurement of chlorophyll fluorescence kinetics has been widely investigated, using red lights at 635 nm or blue lights at 470 nm, in leaves, since these wavelengths are strongly absorbed by chlorophylls.
Commonly, fluorescence is studied via a modulated light beam. Two lights are used: an exciting light and a probing light modulated. This method has the strong drawback of limiting the time resolution of the technique to the frequency of the modulated source.
An innovative idea was to use a green light (520 nm) to induce fluorescence. The exciting and the detecting lights are supplied by the same light source: a LED board : Fluo_59 specialy designed with green LEDs. F. Rappaport et al. (1), proved that fluorescence emitted by the leaf under a strong absorbed beam by chlorophyll was lower than using a weaker absorbed beam such as green light. The light intensity at 520 nm is expected higher throughout the leaf.
Example of application
All experiments were realized using a JTS-10 spectrometer from Bio-Logic (France, Claix)
Several scientific publications report on O-J-I-P experiments where electron transport in PSII is revealed. The different steps, O, J, I and P reflect the different steps in the polyphasic curve obtained whereas the sample is illuminated by a continuous light O is the initial fluorescence measured where all reaction centers are opened.
P: the peak level of fluorescence traduced by a plateau:
I and J the intermediate states reflecting the electron transfer between Qa and Qb.
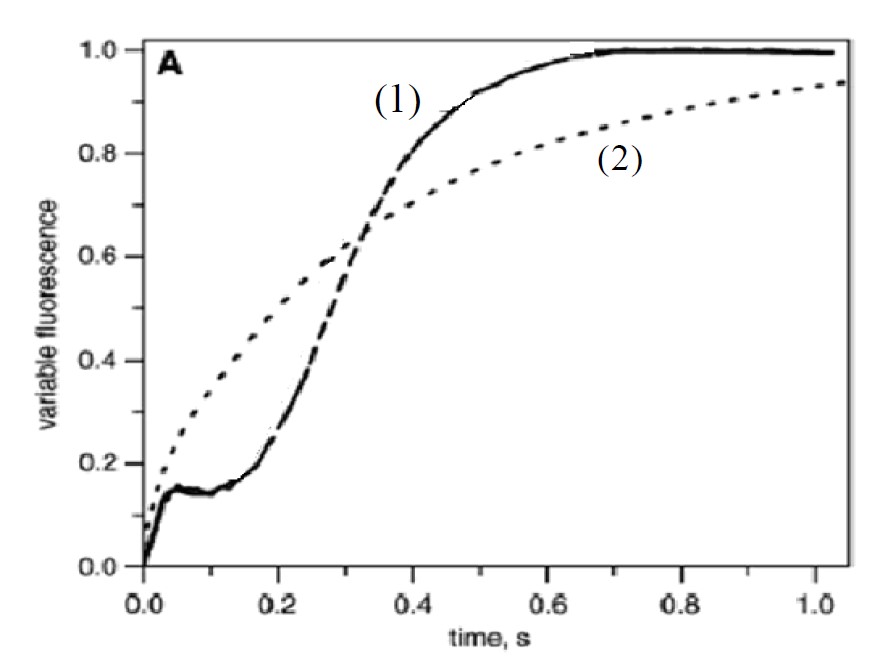
In the example below, a dark adaped young spinach was illuminated by two different lights at 520 nm (use of Fluo_59) and 665 nm in the same conditions using cut- off filter to record Kinetics of fluorescence.

Figure 1: Fluorescence yield induced by a continuous illumination at 520 nm (curve 1) and 470 nm (curve 2) with an illumination tuned so that k=65 s-1
Fluo_59 accessory provides a green actinic light tunable between 12 to 3000µE/m²/s . Saturated pulses of 250 ms or less with an intensity of 5000 µE/m²/s can be superimposed . These two lights (actinic or saturated pulses) are driven independently and can be used simultaneously or individually.
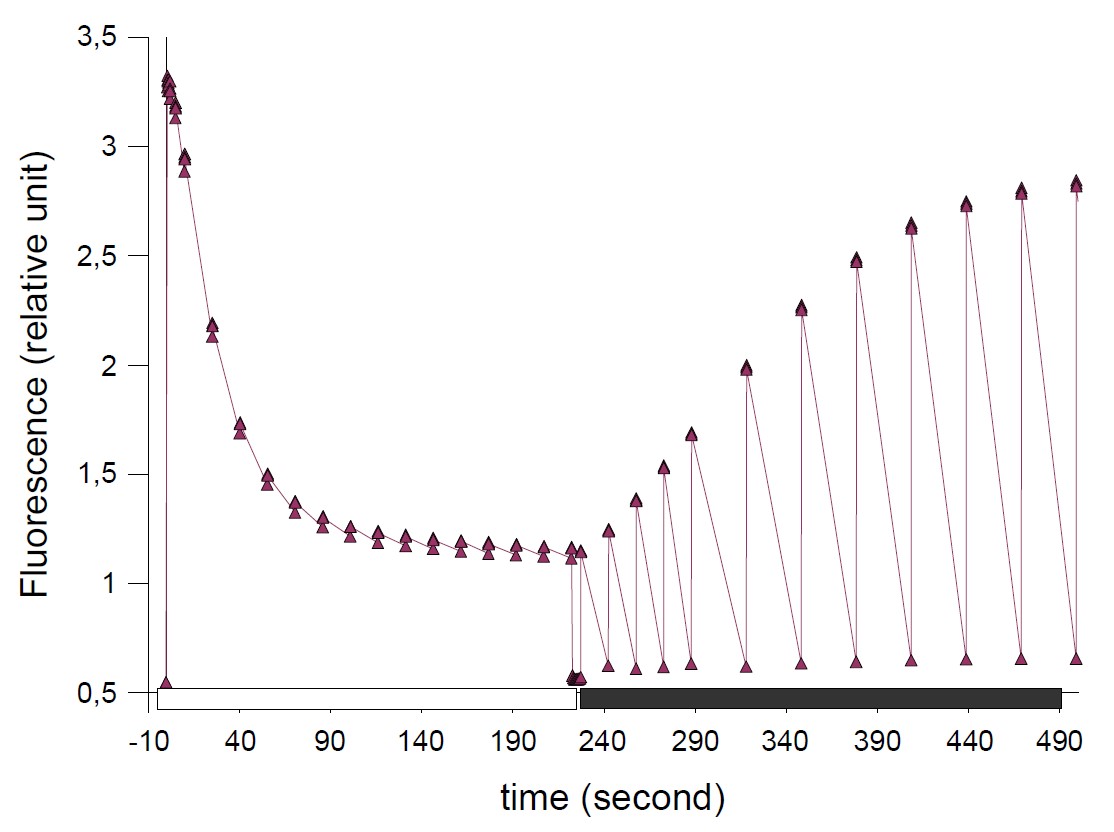
The experiment consists in following the fluorescence yield under a continuous illumination of 700 µE/m²/s with a surimposition of saturated pulses (5000µE/m²/s), emitted to probe parameters, such as Fo, Fm and Fm’ can be obtained. This experiment was done using Fluo_59.

Figure 2: Fluorescence yield changes induced by a continuous illumination. The different peaks correspond to saturated pulses of 250 ms- duration superimposed to the weak continuous illumination (Access to Fo, Fm and F’m parameters) then in the dark.
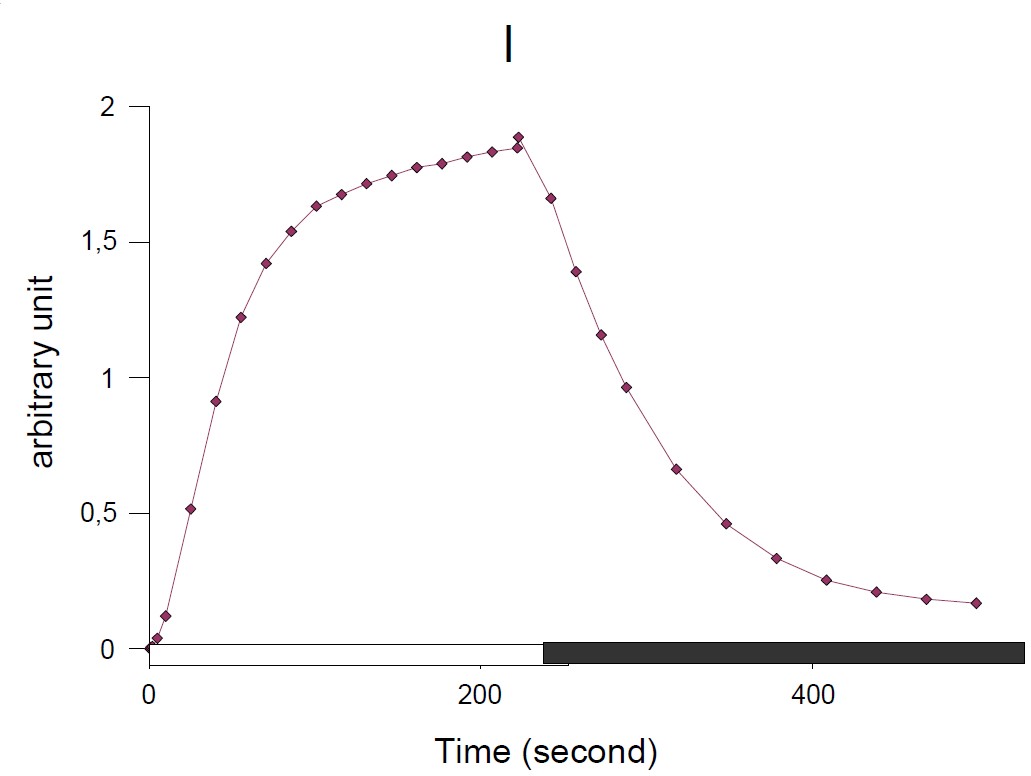
NPQ: Non Photochemical Quenching can be determined via JTS-10 software and its evolution in function of the time, calculated with the equation:
$$\text{NPQ}=(\text{Fm}-\text{F’m})/\text{Fm’}\tag{1}$$
Under the continuous illumination NPQ value increases traducing the blocking of electron in the photosynthetic chain. In the dark, NPQ is decreasing continuously traducing an activity of the photosynthetic chain and electron flow.

Figure 3: NPQ evolution in function of the time: calculated with equation (2)
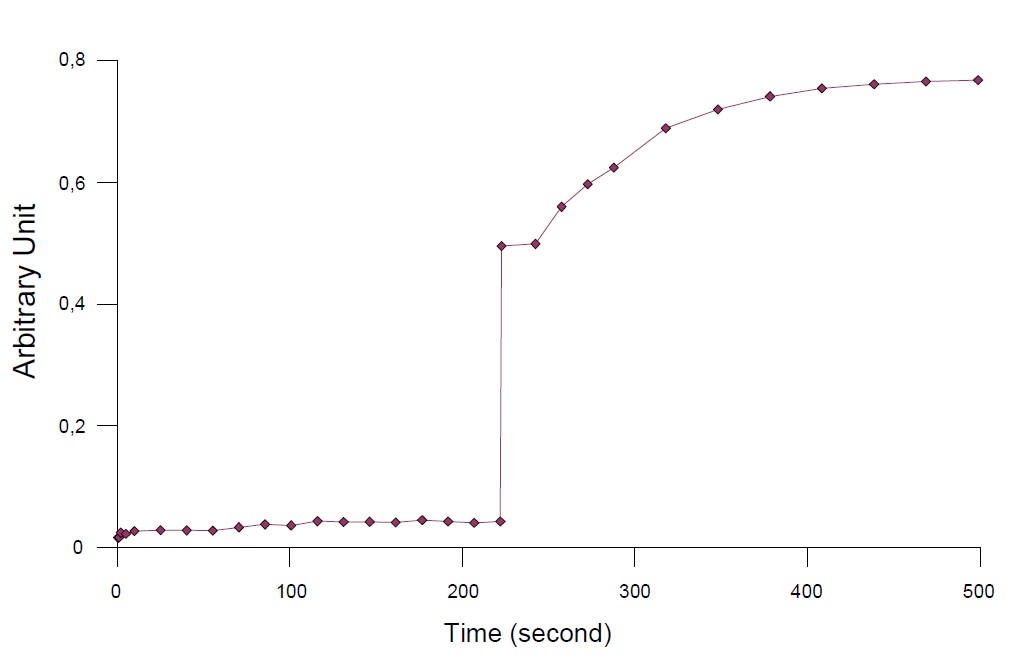
The so-called Genty parameter: PSII is also determined with JTS-10 software. ΦPSII relates the electron flow produced by ΦPSII under steady state conditions.
Its value is calculated via the equation:
$$\Phi \text{PSII}=(\text{F’m}-\text{F})/\text{F’m}\tag{2}$$
Under the illumination, the genty parametrer is low traducing t because the plastoquinon pool is seeked. In the dark, ΦPSII v lue becomes higher because it can be easily reduced.

Figure 4: Genty parameter evolution in function of the time: Calculated with equation (1)
References
- Rappaport, D. Béal, A. Joliot, P. Joliot, On the advantages of using green light to study fluorescence yield changes in leaves, Biochemica et biophysica acta 1767 (2007) 56-65


