

The use of the SVP470 for Vibrating Probe measurements of plants Scanning Probes – Application Note 22
Latest updated: June 17, 2024Abstract
With the Scanning Vibrating Electrode Technique (SVET) the extracellular currents of biological sample can be measured. The SVP470 was used to measure the backside of a spider plant leaf by SVET. SVET measurements show local current densities which correlate to the different features of the leaf.
Introduction
The SVP470 is the scanning vibrating probe module of the M470 scanning electrochemical workstation. Using the SVP470 it is possible to perform vibrating probe measurements to follow the local current distribution of a sample in solution.
Vibrating probe was first introduced by Nuccitelli and Jaffe in 1974 to investigate the extracellular currents associated with biological processes, such as embryo development [1]. Since this time vibrating probe has been applied to the investigation of plant photosynthesis [2, 3], wound healing [4], tumor cells [5], and limb regeneration [6]. Vibrating probe has also been used extensively in the related fields of corrosion and coatings. Vibrating probe was first introduced as the Scanning Vibrating Electrode Technique (SVET) to the field by Hugh Isaacs in the 1980s [7].
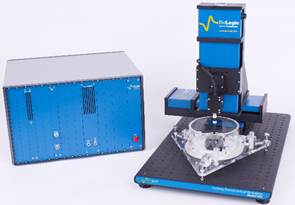
In this note the use of the SVP470, Fig. 1, for the measurement of biological samples is demonstrated through the measurement of a spider plant (Chlorophytum comosum variegata) leaf. Understanding local current distribution is important in the study of plants because it is associated with photosynthetic activity [2, 3], wounding [8], and stress [9].

Figure 1: SVP470 is shown.
More information on the vibrating probe technique can be found in TN#1 [10], TN#2 [11], and TN#8 [12]. For further information on using scanning probe electrochemistry to measure biological samples please see AN#15 [13] and Presentation #1 [14].
Vibrating Probe Principles
Above a naturally active, or biased sample in solution a current is produced. This results in a potential gradient above the active region, due to iR drop. The strength of the potential gradient is related to both the sample activity and the solution conductivity. Vibrating probe measurements can measure the potential gradient above a sample, Fig. 2. From the local potential gradients, it is possible to determine the local current densities which exist.

Figure 2: In vibrating probe the probe samples different potentials based on its position in z.
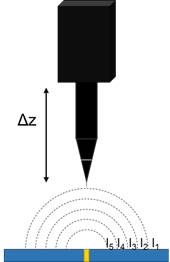
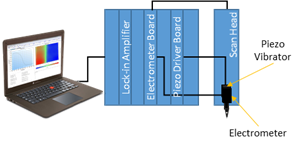
In vibrating probe, the probe vibrates perpendicular to the sample plane, using a piezo vibrator. At a given x,y position, when activity and solution conductivity are constant, the potential measured is dependent only on the position of the probe in its vibration in z. Therefore an ac potential with a dc offset is measured by the electrometer. A dc voltage proportional to the amplitude of the ac signal is obtained as the output of a lock-in amplifier. The electronic components involved in the vibrating probe measurement are illustrated in Fig. 3.

Figure 3: Block diagram of vibrating probe setup.
Typically to obtain the final current density signal of interest the local potential measurement is calibrated to a source of known constant current. The procedure for this conversion is described in TN#2 [11] and TN#8 [12].
Method
The underside of a spider plant leaf was measured by vibrating probe in tap water using the SVP470.
The leaf was removed from the plant and mounted in a glass dish, with the underside up, using blu tack. The glass dish replaced the main body of the TriCellTM (P/N: U-TRICELL), to allow the sample to be levelled, Fig. 4.

Figure 4: Mounting of spider plant leaf for measurement by vibrating probe is shown, prior to the addition of tap water.
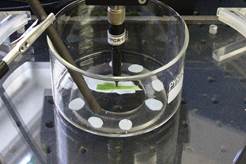
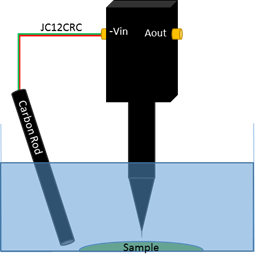
In vibrating probe measurements, a second electrode, aside from the probe, is required to complete the cell and allow a potential difference to be measured. Because a potential is not applied in the experiment shown here, a carbon rod was used as the second electrode. This was connected to the ‘-Vin’ connection of the electrometer by the signal and ground connections of the JC12CRC cable provided with the SVP470, as illustrated in Fig. 5.

Figure 5: Illustration of the electrode and sample setup used for vibrating probe measurement.
The vibrating probe measurement of the leaf was performed over a 500 µm x 500 µm area in Sweep Scan mode, with a scan rate of 1000 µm/s, and point size of 5 µm. To determine the reference phase the auto tune function was used. When using this function the lock-in amplifier determines the reference phase which leads to 0° phase difference between the measured ac signal, and the reference ac signal. By achieving 0° phase difference the signal output is maximized. A detailed description of the auto tune function can be found in the ‘CHM and CTM Signal Demodulation’ page of the M470 Help File. Signal Conditioning settings are shown in Table 1.
Upon completion of the vibrating probe measurement of the leaf the probe was calibrated as described in TN #2 [11], allowing the original potential measurement to be converted to the current measurement of interest.
Table 1: SVP470 signal conditioning settings for the measurement of a leaf.
| SVP470 Signal Conditioning Settings | |
|---|---|
| Gain | 100 |
| Full Scale Sensitivity | 1.6 mV |
| Output Time Constant | 0.1 |
| Vibration Amplitude | 30 µm |
| Vibration Frequency | 90 Hz |
| Reference Phase | Auto Tune |
Post processing, including background tilt correction, was performed using the Gwyddion software [15].
Results
The result of the vibrating probe measurement of the underside of the spider plant leaf are shown in Fig. 6.

Figure 6: Vibrating probe measurement of the underside of spider plant leaf. Epithelial cell (a), stomata (b), and undifferentiated plain cell (c) are circled.
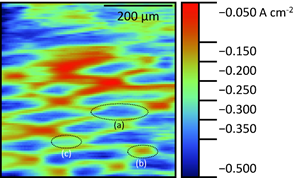
Clear diamond-like structures of higher current density can be seen. These features match well with the shape of the epithelial cells shown in the literature by Chorlton [16]. At the base of some of these epithelial cells smaller oval areas of lower current density are apparent. These correlate to stomatal pores. An example of a possible undifferentiated plain cell has also been noted on the map. The extracellular currents exist due to signaling at the plant leaf, which is regulated by ions. This signaling drives the opening and closing of the plant guard cells to allow diffusion of O2 and CO2 through the stomata.
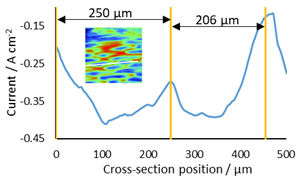
A cross section of a pair of epithelial cells was taken to correlate their length with that in the literature, Fig. 7. The length of the two epithelial cells was shown to be 250 and 206 µm, fitting well with lengths shown by Chorlton [16].

Figure 7: Cross section used to determine length of epithelial cells. The cross section measured is shown as a white line on the thumb nail inset.
Conclusion
This note demonstrates the use of vibrating probe, or SVET, to image the extracellular currents of a plant leaf. Utilizing vibrating probe it was possible to use the local current densities to differentiate between the different features of the leaf. A higher current density could be measured over the epithelial cells than over the stomata.
References
- L. F. Jaffe, R. Nuccitelli, J. Cell Biol. 63 (1974) 614-628
- D. J. F. Bowling, M. C. Edwards, N. A. R. Gow, J. Exp. Bot. 37 (1986) 876-882
- J. S. Lee, Journal of Plant Biology 49 (2006) 186-192
- L. Li, W. Gu, J. Du, B. Reid, X. Deng, Z. Liu, Z. Zong, H. Wang, B. Yao, C. Yang, J. Yan, L. Zeng, L. Chalmers, M. Zhao, J. Jiang, Wound Repair Regen. 20 (2012) 840-861
- L. Li, K. Zhang, C. Lu, Q. Sun, S. Zhao, L. Jiao, R. Han, C. Lin, J. Jiang, M. Zhao, Y. He, Oncotarget 8 (2017) 95741-95754
- R. B. Borgens, J. W. Vanable Jr., L. F. Jaffe, PNAS 74 (1977) 4528-4532
- Isaacs, H.S., J. Electrochem. Soc. 135 (1988) 2180-2183
- S. A. R. Mousavi, C. T. Nguyen, E. E. Farmer, S. Kellenberger, Nat. Protoc. 9 (2014) 1997-2014
- P. M. Gil, L. Gurovich, B. Schaffer, N. García, R. Iturriaga, Plant Signal Behav. 4 (2009) 100-108
- SCAN-Lab TN#1 “Magnitudes and principles used in Scanning Vibrating Electrode Technique”
- SCAN-Lab TN#2 “Practical methods to correlate the SVP voltage to a current at a sample’s surface”
- SCAN-Lab TN#8 “Scanning Vibrating Electrode Technique (SVET): factors affecting the measurement”
- SCAN-Lab AN#15 “Introduction to the USB-PIO: measuring the effect of light on a live leaf”
- SCAN-Lab Presentation #1 “Application of scanning probe electrochemistry for biological studies”
- Gwyddion data analysis software http://gwyddion.net/
- W. A. Charlton, Ann. Biol. 66 (1990) 567-578


