How to use SECM approach curves for energy applications
Latest updated: January 14, 2025The area scan often comes to mind first when thinking of Scanning Electrochemical Microscopy (SECM) experiments. Just as important, however, is the approach curve (sometimes referred to as Probe Approach Curve or PAC) which is performed as part of the workflow leading to an area scan, and/or as a stand-alone experiment type to examine the sample under study.
What happens during an SECM approach curve?
During an SECM approach curve a, typically, potentiostatic bias is applied to the UltraMicroElectrode (UME) probe as it moves towards the sample surface. When feedback mode is used, the applied potentiostatic bias results in the probe interacting with a redox mediator in solution. As the probe moves from bulk electrolyte towards the sample, the sample influences the current measured by the SECM probe. Hemispherical diffusion of the electroactive species at the disk allows mass-transport-controlled kinetics to easily be reached. When this occurs the steady-state current is expressed by:
$$i_\text{ss} = 4nFDC^*r_0$$
Where iss is the steady-state bulk limiting current in A, n is the number of electrons transferred, F is the Faraday constant in C mol-1, D is the diffusion coefficient in cm2 s-1, and C* is the bulk concentration in mol cm-3, and r0 is the probe radius in cm. When the probe is near an insulating (inactive) substrate, the substrate acts to block diffusion of the redox mediator to the active region of the probe, the result is a lower current measured over the insulating substrate, than the current measured in bulk electrolyte. If instead the probe is near a conductive (active) substrate, the substrate acts to regenerate the redox mediator increasing the concentration available to the biased probe. The result is a higher current when the probe is near a conductive substrate, than when it is in bulk electrolyte. As the probe moves towards the sample from bulk solution, we see the current rapidly decay when the approach is to an insulator, this is negative feedback. When the probe moves from bulk solution towards a conductor there is a rapid increase in current, known as positive feedback. These ideal situations are illustrated in Fig. 1.

Figure 1 : The negative feedback witnessed during approach of the probe from bulk electrolyte to an insulating sample is illustrated in (a). The positive feedback witnessed during approach of the probe from bulk electrolyte to a conducting sample is illustrated in (b).
Note the situation differs when ac-SECM is of interest, in which case an ac-bias is applied to the probe. As with dc-SECM there is a change in signal, in this case impedance, on moving the probe from the bulk electrolyte towards the sample surface. For ac-SECM, however, the response is determined not only by the sample surface conductivity, but also by the electrolyte and the measurement frequency. This is explained in ac-SECM101: An Introduction to Alternating Current-Scanning Electrochemical Microscopy.
Why run an SECM approach curve?
Approach curves are often the first step in running an SECM workflow, which includes the area scan. Because the approach curves behave in a known way, they offer a reliable means of positioning the SECM probe near the substrate ready for the area scan. By fitting the approach curve, for example using MIRA, it is even possible to determine how far from the sample surface the probe is, something which would be difficult or impossible using visual methods. The approach curve is usually performed at multiple locations on the sample surface before running an area scan to ensure the sample is level enough to continue, and/or to determine the sample tilt to allow it to be compensated for during the measurement.
For many researchers, positioning is the sole reason for running an approach curve, however there are a number of groups for whom the approach curve is an experiment of interest for the further information it can provide on the system under study. There are a few reasons to use the approach curve for more than just probe positioning, and even as a stand-alone measurement.
- Because the approach curve response is highly sensitive to the probe to sample distance it can be used to determine in situ if there are any changes in sample topography, e.g. if there is electrode swelling, when there are no associated changes in sample conductivity.
- The shape of the approach curve is highly dependent on the sample surface conductivity. Using the approach curve researchers can quickly gauge changes in sample conductivity, for example after surface functionalization, based on changes to the approach curve shape, and trend.
- The approach curve depends on the kinetics of the electrochemical reaction occurring in the probe to sample gap. By running and fitting an approach curve, researchers can gain insight into reaction kinetics.
How have SECM approach curves been applied in energy storage and conversion?
To illustrate the usefulness of SECM approach curves for purposes other than probe positioning, we look at their use in the field of energy storage and conversion.
Electrode swelling
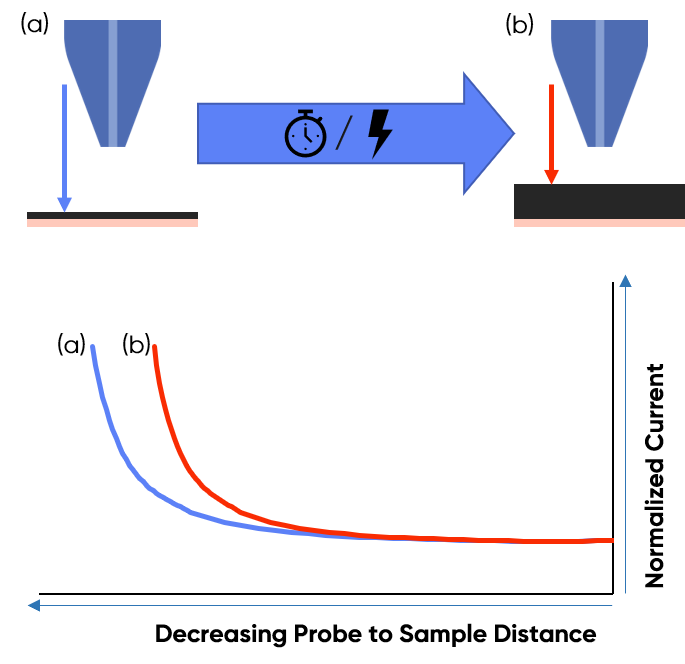
The high sensitivity of the approach curve to the probe to sample distance has been exploited for studies of the swelling of both supercapacitor, and battery electrodes. In studies of supercapacitor electrodes by Fic et. al. activated carbon electrodes were subjected to different bias voltages, with approach curves performed simultaneously [1]. Using the approach curves it was possible to measure the volumetric change of the electrode with changing electrode bias, providing information on the potential regimes which result in the largest volumetric changes. Similarly, Bütler et. al. have used probe approach curves to investigate, in situ, the effect of time on the swelling of graphite composite electrodes used in Lithium-Ion Batteries (LIB) [2]. This use is illustrated in Fig. 2.

Figure 2 : Illustration demonstrating the use of an SECM approach curve to investigate volumetric changes in a sample. In (a) the sample volume is small resulting in a longer approach curve, than in (b) where the sample volume has increased, and the approach curve is shorter.
Initial investigation of sample conductivity
Investigations by Liu et. al. on LiMn2O4 (LMO), a common cathode material in aqueous LIBs, in a “water-in-bisalt” electrolyte, also utilized the approach curve [3]. Prior to performing more in-depth studies of the LMO, including biasing within its working potential window, the pristine LMO was first studied by approach curve to determine its conductive nature. The approach curve experiments showed pristine LMO to be a conductor, as indicated by the exponential increase in current during the approach.
Changes in sample conductivity
Liu et. al. investigated the effect of cycling on a Super P conductive carbon, and PolyVinyliDene Fluoride (PVDF), model LIB electrode [4]. Approach curves measured to the electrode in a pristine state, and after cycling were used to study the change to sample conductivity with cycling. When cycling was performed in the low potential region, the approach curves change from positive feedback at the pristine electrode, indicative of a conductive electrode, over the first few cycles the normalized current decreases, still with positive feedback, however after 10 cycles the approach curve changes to negative feedback. This change in feedback indicates a change to insulating behavior with increased cycling and growth of the Solid Electrolyte Interface (SEI). When repeated in the high potential region, negative feedback also occurs with cycling, however it is delayed to the 20th cycle due to differences in the SEI which forms.
Conclusion
The probe approach curve is an important experiment for the SECM technique. While it can be used as part of the wider workflow required to perform an SECM area scan, it is also important as a standalone experiment. Using the SECM approach curve researchers can not only position their SECM probe in Z, they can also investigate volumetric sample changes in situ, quickly study sample conductivity, and investigate reaction kinetics.
References
- K. Fic, A. Płatek, J. Piwek, J. Menzel, A. Ślesiński, P. Bujewska, P. Galek, E. Frąckowiak, Energy Storage Mater. 22 (2019) 1-14
- H. Bülter, F. Peters, J. Schwenzel, G. Wittstock, J. Electrochem. Soc. 163 (2016) A27-A34
- S. Liu, D. Liu, S. Wang, X. Cai, K. Qian, F. Kangabe, B. Li, J. Mater. Chem. A, 7 (2019) 12993-12996
- S. Liu, X. Zeng, D. Liu, S. Wang, L. Zhang, R. Zhao, F. Kang, B. Li Front. Chem. 8 (2020) 114


