Investigation of impedance measurements using the Z Sim tool (Electrochemistry Basics Series)
Latest updated: November 18, 2024Z Sim is a simulation tool available on both EC-Lab® and BT-Lab® software. It can be used both for research purposes and as an educational tool for teaching. This tool allows us to simulate the data of an impedance measurement based on a specific equivalent circuit with its own parameters, throughout a chosen frequency range.
First of all, the user has to chose or design an equivalent circuit using the graphic or text editor. More details about these design tools can be found in the ZFit tutorial topic, and, more specifically, in video n°3.
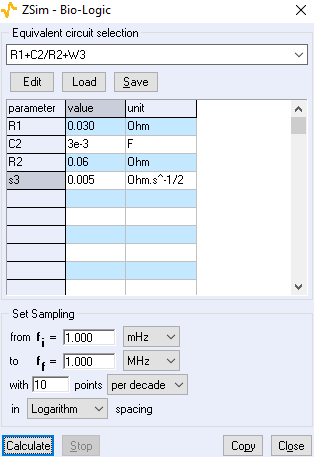
Then, the frequency range and the “sampling” have to be set. The “sampling” is the number of points used throughout the entire frequency range (select “use from fi to ff”), or the number of points per decade of frequency. It is also possible to specify if the spacing between points is linear or logarithmic (Figure 1).

Fig. 1: Z Sim interface showing the equivalent circuit selection, and simulation parameters
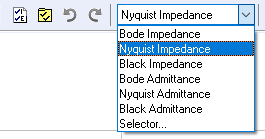
The next step is to click on “calculate” to perform the simulation, and display a simulated Nyquist plot. It is also possible to change the representation of the simulated data by using the representation dropdown menu, or the selector icon (Figure 2).

Fig. 2: How to change the graphical representation of data inside EC/BT-Lab® software
Z Sim is particularly useful for simulating the behavior of the low-frequency parts of systems (see Application Note 61). This saves time and avoids cell drift due to time variance (related article available here). For example, a measurement from 1 MHz down to 10 µHz with 6 frequencies per decade will take around 100+ hours, but with Z Sim, it is instantaneous. It can also be used to simulate inductance at high frequency to study its impact on the ohmic drop determination (see Application Note 44 and Application Note 62).


