Split electrochemical impedance spectroscopy (EIS) experiments into multiple sequences: save time without compromising quality
Latest updated: November 18, 2024Reliable impedance measurements require the system under study to remain linear and stationary during the whole measurement sequence. This article describes the ideal configuration for studying time-variant systems such as batteries, corrosion systems or supercaps to save time while maintaining good measurement quality.
Split an EIS experiment into sequences
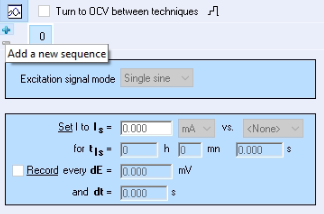
EC-Lab® and BT-Lab® software allow the user to split an EIS experiment into multiple sequences. It is possible to use different parameters to optimize the experimental conditions. From one sequence to the other, each parameter can be changed: the sampling rate (points per decade), the waiting time (Pw), the frequency range or the input amplitudes etc. To add a sequence to the EIS experiment, click on the “+” button available at the top left corner of the EIS techniques (Figure 1) as many times as needed. Sequence 0 and 1 are now available. It is possible to switch from one to the others by clicking on the desired number.

Fig.1: how to add a sequence to a EC-Lab®/BT-Lab® techniques
Save time with no compromises on quality: optimization of an EIS experiment carried out on a battery
An impedance measurement is performed on a LIR2032 battery from 1 MHz to 10 mHz. The first experiment consists of scanning the entire frequency range using the following parameters:
- Sinus amplitude Ia = 2 mA
- Point per decade Nd = 10 (log spacing)
- Wait for Pw = 0.10
- Average Na =2

Fig.2: an impedance measurement experiment divided into several sequences.
This will induce a reduction of the total duration of the experiment from 34.05 min to 21.68 min (12 min saved). It can be an important factor if the system changes over time (for example in the case of EIS measurements during charge/discharge).

Fig.3: differences between a single and a multiple sequences experiment done on a battery.
Differences on fitting results – like-for-like comparisons
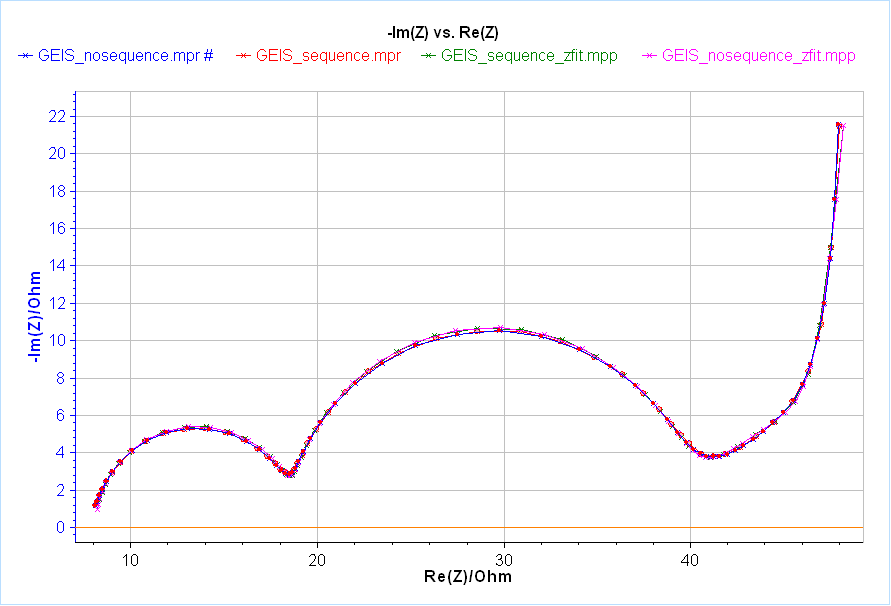
The results obtained using a battery can differ due to the repeatability of battery measurements. In this case, carrying out the exact same measurement can lead to different fitting results. To make a like-for-like comparison, we perform the same experiment using a Dummy Cell (DC-BCS) which is supposed to be time-invariant. This dummy cell was chosen because of the similarity of its response with the one obtained using a battery.

Fig.4: DC-BCS experimental measurements comparison.
The data are fitted using the Z Fit analysis to check the value of the $\chi/\
$\chi/\
| Without sequence | With sequence | |
| R1 /Ohm | 8.109 | 8.102 |
| C2 /F | 16.87e-6 | 16.83e-6 |
| R2 /Ohm | 10.33 | 10.37 |
| C3 /F | 1.062e-3 | 1.058e-3 |
| R3 /Ohm | 19.89 | 19.93 |
| Rd4 /Ohm | 24.61 | 24.53 |
| t4 /s | 18.84 | 18.79 |
| a4 | 0.9462 | 0.9492 |
| $\chi/\ |
0.1302 | 0.1287 |
It is clear that despite the fact that there are fewer data points to be fitted, there is a negligible effect on parameter values or fit quality.
GEIS-AA: When linearity matters!
Most studied systems are non-linear (batteries, super-capacitor, corrosion experiments etc). In order to perform reliable EIS experiments on them, it is necessary to use a low modulation amplitude. The amplitude used, has to be high enough to be separated from the noise signal, but not too high to avoid going out of the linearity range.
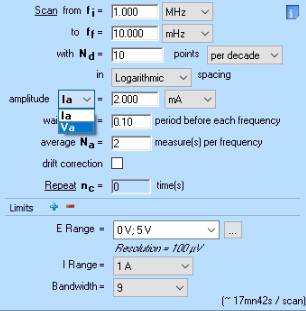
To guarantee an output signal remaining at the same level throughout the entire frequency range, it is necessary to modulate the input amplitude. For this purpose, BioLogic developed a specific technique that allows the system to adapt the input sine amplitude (galvano control mode = Ia) in order to obtain the specified output sine amplitude (potentio measurement = Va): the GEIS-AA. To do so, load a standard GEIS technique, and modify the “Ia” dropdown menu to select “Va”.
Fig.5: dropdown menu to switch from GEIS to GEIS-AA technique
Additional information
Related products


